

The GE McKinsey Matrix can be an invaluable tool for your startup, and in this guide we will explain why. Indeed, in the next few lines you will discover what it is used for, what its main components are, how to build one and how to analyze its results. Alongside these fundamental theoretical notions, you will also find, in addition, a practical example of its application.
GE McKinsey Matrix: origins and development
The GE McKinsey Matrix is also known as the General Electric Matrix or the McKinsey Matrix.
The reason is quickly stated: this particular strategic analysis tool was designed by the consulting firm McKinskey & Company in 1969 on behalf of the company General Electric. The latter had a very diverse portfolio of products and services and was dissatisfied with its ROI. Accustomed to making investment decisions among its various business units based on projections of future cash flows and future market trends, General Electric was looking for a new system for deciding where to allocate resources. The answer to its need was precisely the GE McKinsey Matrix.
In the 1970s, this tool became one of the most widely used methodologies by companies around the world and still today, despite some criticism over time, it plays an important role in strategic analysis and business planning, helping companies assess the competitiveness of their products/services or business units within their target market and develop effective and sustainable strategies to improve competitive position.
Main components of the matrix
To help companies make better strategy decisions, the GE McKinsey Matrix considers two main factors: industry attractiveness and business unit strength.
Industry Attractiveness
Industy attractiveness stands for how advantageous it is for the company to enter and compete in a particular industry based on its profit potential. Market analysis is based on several factors, including the size of the market itself, growth, profitability, competition, regulation, and level of innovation.
Business Unit Strength
A firm’s competitive strength is a variable that measures how strong a product/service or business unit is relative to competitors in the segment in which they compete. Again, there are several aspects that affect the assessment: among them are market share, profitability, innovativeness, brand strength, and distinctive competencies.
Construction of the GE McKinsey Matrix
Now that you know what the two key components of the GE McKinsey Matrix are (industry attractiveness and business unit strength), you can move on to the next step: building one and finding out the results.
Identifying business units
The first step in constructing the GE McKinsey Matrix is, first of all, to identify the business units or products you wish to analyze with this tool and which, therefore, you will need to place within it.
Assessing market attractiveness and competitive strength
Once you have identified the business unit to be analyzed, you need to focus on its market potential by assessing the attractiveness of the industry in which it operates and its competitive strength.
The next step is to draw the matrix, with the vertical axis indicating precisely the industry attractiveness while the horizontal axis representing the company’s business unit strength.
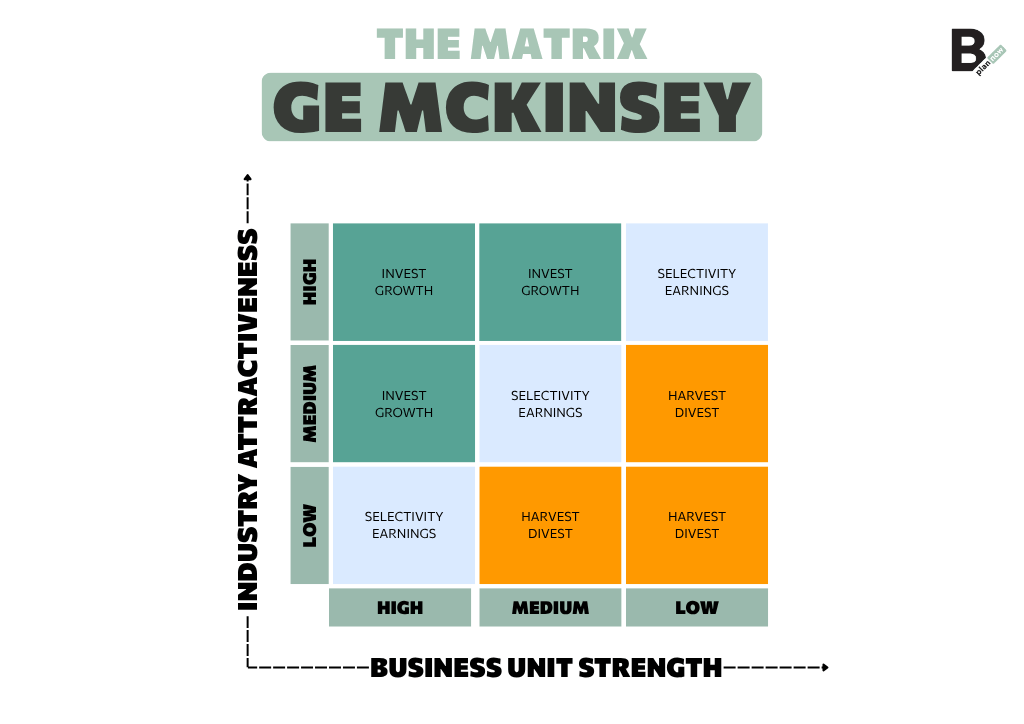
Positioning in the 3×3 matrix
Both the vertical axis (i.e., that of industry attractiveness) and the horizontal axis (the firm’s business unit strength) should be divided into 3 equal parts, corresponding to the High, Medium and Low levels of the two variables.
It follows that the GE McKinsey Matrix consists of 9 quadrants, which are derived from the intersection of the variables and their different levels. Each quadrant corresponds to a scenario and certain strategic actions.
Interpretation of results and strategies
To best interpret the results of the GE McKinsey Matrix and adopt appropriate strategies, it is essential to know the scenarios associated with each quadrant.
To make the analysis easier, the GE McKinsey Matrix is generally divided into 3 green quadrants (Investment/Growth), 3 blue (Selectivity/Earning), and 3 orange (Harvest/Divest).
The green (Investment/Growth) quadrants are:
- High Sector Attractiveness/High Competitive Strength quadrant
- High Sector Attractiveness/Medium Competitive Strength quadrant
- Medium Sector Attractiveness/Medium Competitive Strength quadrant.
The blue quadrants (Selectivity/Earning) are:
- High Sector Attractiveness/Low Competitive Strength quadrant
- Medium Sector Attractiveness/Medium Competitive Strength quadrant
- Low Sector Attractiveness/High Competitive Strength quadrant.
Orange quadrants (Harvest/Divest) are:
- Medium Sector Attractiveness/Medium Competitive Strength quadrant
- Low Sector Attractiveness/Medium Competitive Strength quadrant
- Low Sector Attractiveness/Low Competitive Strength Quadrant.
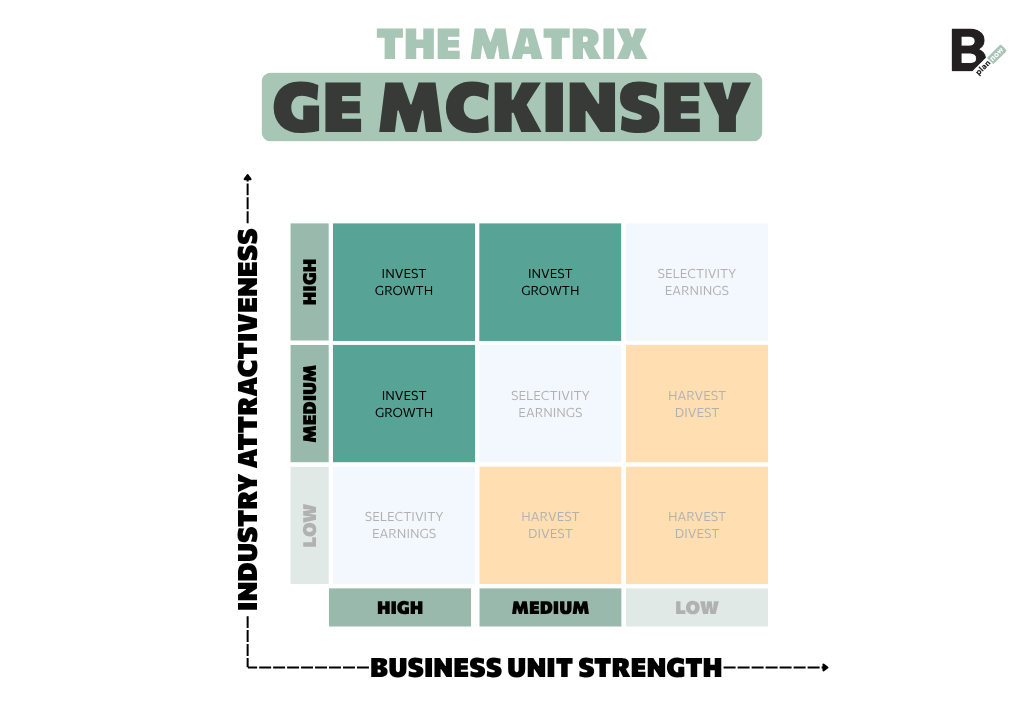
Investment and growth for favorable positions
If products fall into one of the green quadrants you should invest in them because they promise high returns in the future. Generally, these are growth businesses that require a lot of investment, usually oriented to the areas of research and development (to improve products) or communication (to reach new customers), so as to quickly increase market share.
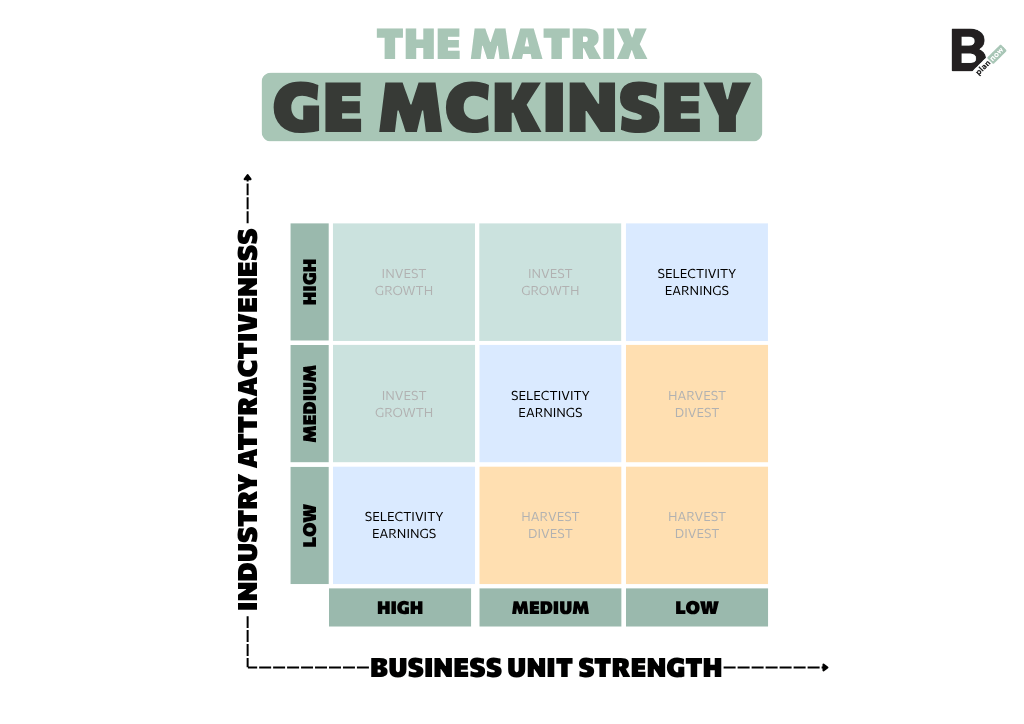
Selectivity for medium positions
The choice of whether or not to invest in the activities that fall in the blue quadrants depends on what you did previously for the products in the green quadrants: once you have allocated the necessary resources for the development of those products, if and only if resources remain you can invest in the activities in the blue quadrants that you think will generate further profit in the future.
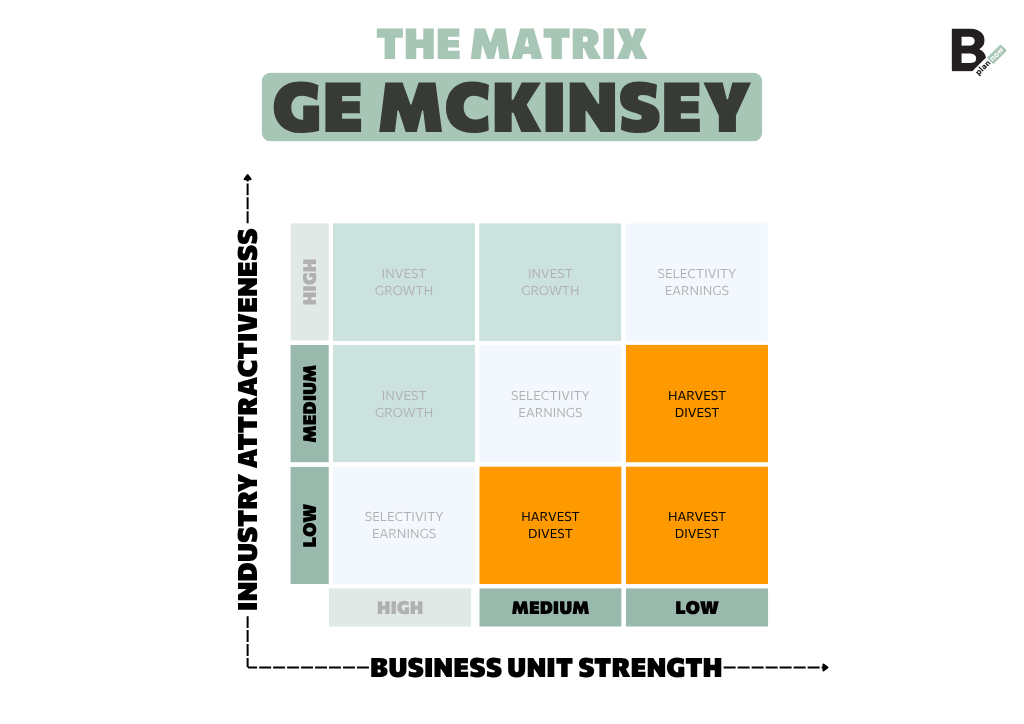
Harvest for unfavorable positions
The activities or products that fall in the orange quadrants operate in unattractive market segments and do not have sustainable competitive advantages. Evaluate assets one by one so you understand which ones generate profit and which do not, and invest the minimum possible that allows you to make the most profit.
Advantages and limitations of the Matrix
Before moving from theory to practice, finding out how you can apply the GE McKinsey Matrix in practice, you need to know it a little more. Specifically, you need to know its strengths and weaknesses.
“Strategy, without process, is little more than wishful thinking”
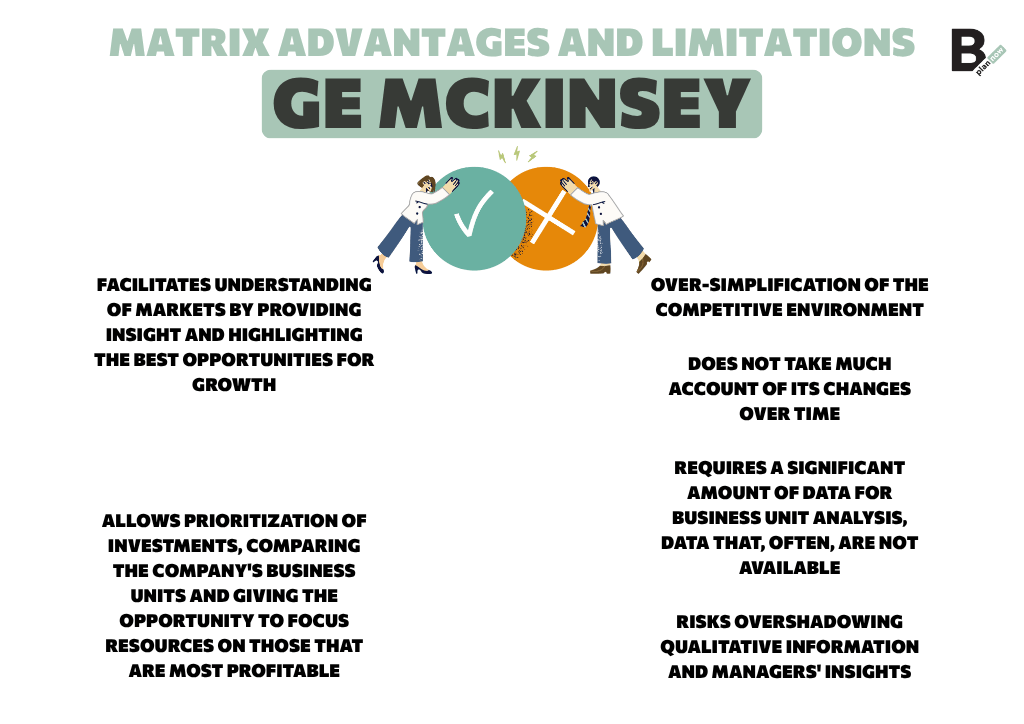
goes a famous quote by Robert Filek. We have not quoted it at random: among the main benefits associated with the use of the GE McKinsey Matrix is the fact that it facilitates the understanding of markets by providing insight and highlighting the best opportunities for growth. Not only that: as already pointed out, it makes it possible to prioritize investments, comparing the company’s business units and giving the opportunity to focus resources on the most profitable ones.
The main limitations of the matrix are, however, related to the oversimplification of the competitive environment and the fact that the tool does not take much account of its changes over time. Another critical point is the significant amount of data it requires for the analysis of business units, data that, often, are not available (or are not reliable).
There is one more downside to mention: the GE McKinsey Matrix runs the risk of putting qualitative information and managers’ insights on the back burner compared to a formal analysis, which, moreover, considers only a few specific factors and has a rather rigid structure.
To overcome the limitations of the GE McKinsey Matrix you can adopt several solutions: customize the matrix to fit the specific needs of your startup, improve the quality of the data used in it, review it periodically, and integrate it with other strategic analysis matrices and models.
Application of the GE McKinsey Matrix in Startups
The GE McKinsey Matrix was initially developed for very large companies for the purpose of analyzing their internal divisions in the presence of a scenario characterized by many initiatives that can be invested in and few resources to invest in.
This tool, however, can be used equally to examine separate product lines or products and is therefore also valuable for an SME or innovative startup, which, precisely because of it, can analyze its product portfolio.
Practical Example of the GE McKinsey Matrix
We close this guide devoted to the GE McKinsey Matrix with a practical example of its use, related to streaming giant Netflix. When it started the service in 2007, streaming accounted for only a small portion of its revenues (there were 1000 streaming titles and 70000 physical DVD titles).
Over the years, also accomplice to the bankruptcy of Blockbuster, the increase in Internet speed, the introduction of new technologies, and changes in consumer preferences, Netflix has recognized the decline in the attractiveness of physical media and the rise of streaming enjoyment of audiovisual products, applying growth strategies and heavy investment in this area.
Do you want to read all the articles related to the stage your startup is in?
