
“If you can’t measure it, you can’t improve it.”
Lord William Thomson Kelvin, 19th century British physicist and engineer.
Measuring data gives us a basis for comparison and allows us to identify areas for improvement in any activity. Only then can you develop and implement strategies to achieve the improvement you desire. And if there is one valuable gift the Internet has given mankind, it is data measurement.
Analytics tools are used to understand how an activity we have started is performing. Whether it is a website, an advertising campaign, a new landing page or a social media page, there is an Analytics tool for everything.
Normally, there are two categories of such tools: simple tools, with a low learning curve, and more complex tools, for insiders. However, even the easiest Analytics tools possess advanced features and functionality that require a certain amount of subject matter expertise.
Analytics tools then give access to insights, or statistics, which report details that can go very deep. You can track clicks, impressions, views, user behavior, and even the portions of the page that the human eye lingers on.
There are no limits to Analytics: if you are looking for the right tool for your project, here is a list of all the best tools on the market and their capabilities!
Best analysis tools for beginners
Google Analytics

Google Analytics (GA) is probably the most popular web analytics tool. This free tool offered by Google allows you to monitor the traffic and performance of your website or mobile application by accessing a wide range of data and reports that can be used to better understand site visitors, their actions, and the effectiveness of marketing initiatives.
Google Analytics 4 (GA4) is the current version of Google’s web analytics platform. GA4 uses an event-based data model-meaning it collects and records every interaction a user has with your website or app, such as clicks, screen views, video plays, and conversions.
These events are then organized into customizable data streams, allowing you to analyze user behavior in a more granular way and correctly attribute value to conversions.
To get started with GA4, you need to create a Google account and follow the steps on the Google Analytics website to set up tracking for your website or app.
In general, GA4 offers an intuitive and user-friendly user interface; understanding statistical data is quite easy, as is investigating it in detail among filters and reports. In addition, Google has provided numerous learning resources, including guides, tutorials, and videos, which can help you familiarize yourself with the platform.
Hotjar

Hotjar is a web analytics tool that offers a suite of features to better understand user behavior on your website or application. Unlike other traditional analytics tools such as Google Analytics it offers qualitative analysis of user behavior, rather than just quantitative data.
Hotjar uses several techniques to collect data on user behavior, including:
- session recordings, i.e., screenshots of each user session;
- heatmap, a heat map in which you can pinpoint the areas of your website or app that users click on or look at the most;
- visitor feedback, which it collects in the form of polls, comments and open questions directly from users;
- A/B test with different versions of web pages or elements to see which works best;
- funnel analysis that analyzes the path of users through your website or app to identify any points of abandonment or optimization.
Navigation on Hotjar is simple and straightforward, allowing you to quickly find the information and features you need. Data is presented in a visually appealing and understandable way, using heatmaps, session records, and other visualization tools.
Heap

Heap Analytics is an innovative web analytics tool that offers a comprehensive and intuitive approach to understanding user behavior. Unlike traditional tools like Google Analytics, which rely on sessions and page views, Heap automatically collects and records every interaction a user has with your website or app, creating a complete record of their digital journey.
Heap offers a clean, modern user interface that is easy to navigate and understand. It presents data in a visually appealing and intuitive manner using customizable charts, tables, and dashboards, and allows users to explore data independently, without the need for advanced technical skills, thanks to powerful filtering and segmentation features.
Heap not only provides data on “what” users do, but also helps to understand the “why” behind their actions by providing contextual information and insights into behavior.
It also offers a wide range of support and training resources, including guides, tutorials, and webinars, to help you get started and take full advantage of the tool.
Crazy Egg

Crazy Egg is a web analytics tool that offers heatmap and session recording capabilities to help you better understand user behavior on your website. By visualizing the areas that users click and scroll on, Crazy Egg helps you identify points of interest, areas of confusion, and opportunities for optimization.
The tool works by inserting a small code into your website. Once installed, it starts recording user interactions, creating heatmaps that show the most clicked and the hottest areas. You can also use session recordings to literally see how users navigate, interacting with various elements.
This Analytics tool is easy to use, in fact heatmaps and session records provide an immediate visual representation of how users interact with your website.
What’s more, Crazy Egg allows you to compare different versions of pages or elements to see which works best in terms of engagement and conversions by conducting real A/B tests.
Matomo
Matomo, formerly known as Piwik, is an open source web analytics platform that offers comprehensive functionality and a user-friendly interface, making it accessible even to less experienced users. It is installed on your website or app, automatically recording user interactions and collecting detailed data on user behavior. Unlike SaaS tools, Matomo gives you full control over your data by hosting it on your own server.
It offers a wide range of features, including:
- comprehensive web monitoring that tracks page views, time spent on the site, events, conversions, and more;
- customizable drag-and-drop reports;
- advanced segmentation by various criteria, such as device, geographic location, traffic source, and behavior;
- in-depth analysis of data to identify trends, patterns, and areas for improvement.
- privacy compliance with the rigorous standards of the GDPR and CCPA.
Installation and configuration of Matomo is simple and requires minimal technical knowledge. The user interface is clean, modern, and easy to navigate, even for inexperienced users.
Improved analysis tools of intermediate and advanced difficulty
Tableau
Tableau is a business intelligence and data visualization platform that enables you to transform raw data into engaging, easy-to-understand visual information. It allows you to create interactive dashboards, charts and reports to analyze and communicate data effectively.
Tableau offers several features that make it a powerful tool for data analysis:
- engaging and interactive visualizations that simplify the understanding of complex data;
- in-depth analysis with powerful calculation and analysis capabilities;
- sharing dashboards and reports with other users;
- connectivity to various data sources, including databases, spreadsheets, CSV files, and Web APIs;
It must be said, however, that Tableau offers advanced computational features to manipulate and analyze data in greater depth that raise the learning curve.
It is an ideal choice for companies of all sizes that operate with large volumes of complex data and need powerful and versatile analysis tools.
Looker
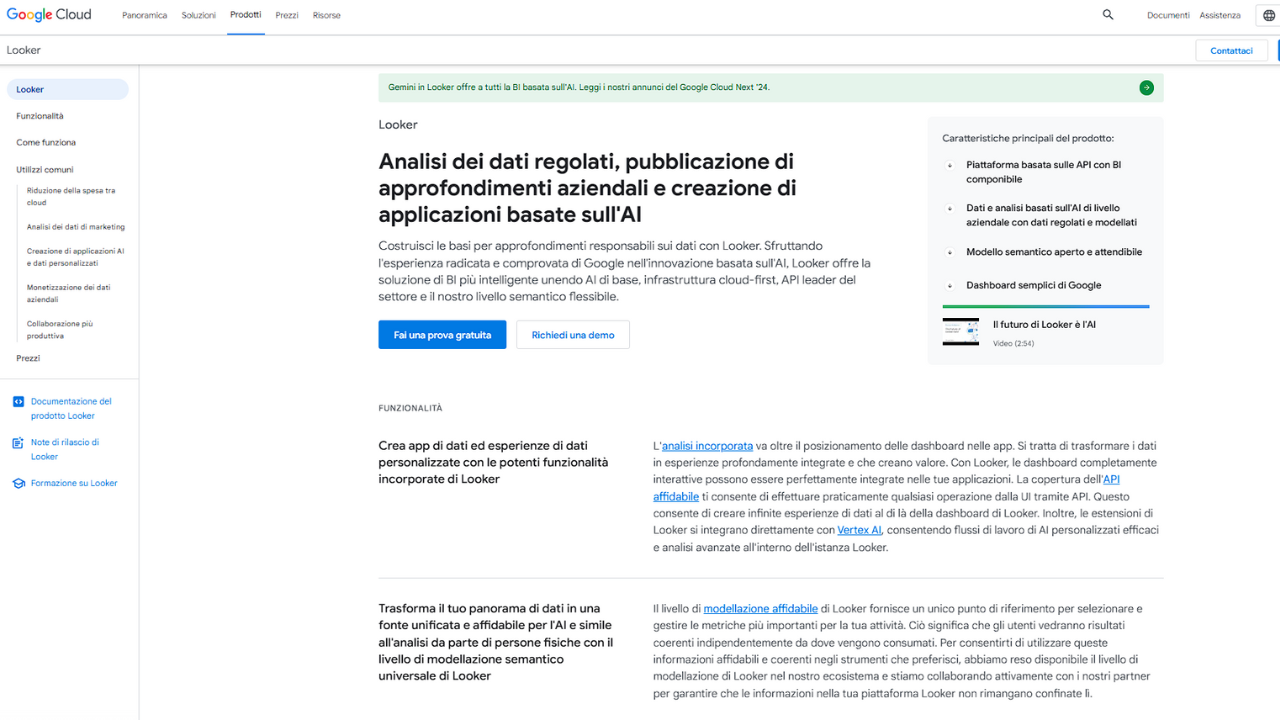
Looker is a business intelligence and data analytics platform that has been integrated into the Google Cloud Platform suite since 2019. It offers advanced capabilities for companies that need powerful and scalable tools to explore, analyze, and visualize large volumes of data. It focuses on data modeling, creating a centralized, structured model that facilitates analysis and understanding of data from multiple sources.
Looker can manage large volumes of data efficiently and scalably to meet growing business needs. It meets stringent security and compliance standards, ensuring the protection of corporate data, and integrates artificial intelligence and machine learning capabilities to automate analysis tasks and derive deeper insights from data.
Being part of the Google Cloud PlatformLooker integrates with a wide range of other Google Cloud products, such as BigQuery, Cloud Storage and Dataflow, to create a complete data analysis workflow.
Qlik Sense

Qlik Sense is a business intelligence and visual data analysis platform available both as an online solution (SaaS) and as software to be installed locally (on-premise). It is based on a patented data association engine that automatically links data together, regardless of how it is structured or where it comes from.
This associative approach allows the data to be explored in a nonlinear way, following the natural relationships between different fields and without having to define complex queries.
Within it, you can quickly find the data you are interested in using the powerful built-in search function and create a wide range of data-driven visualizations, including pie charts, bar charts, maps, and scatter plots, to communicate data effectively.
You can explore data in depth with powerful calculation and analysis features, including aggregations, filters, and segmentations, and connect to a wide range of data sources, such as databases, spreadsheets, CSV files, and Web APIs.
Mixpanel

Mixpanel is a product analytics platform that offers advanced capabilities for companies that need powerful tools to monitor user behavior, understand product usage and optimize conversions.
Unlike generic analytics tools such as Google Analytics, Mixpanel focuses specifically on analyzing user behavior within a digital product, such as a website or mobile app.
Mixpanel uses event tracking to record users’ interactions with the product. These events can include clicks, page views, sign-ups, transaction completion, and any other significant action a user takes. It allows these events to be analyzed in detail, segmenting users by various criteria and creating custom reports and visualizations to gain valuable insights into user behavior.
Mixpanel offers several advanced features that make it a powerful tool, but also more complex to use than other analysis tools:
- initial setup that may require some technical knowledge to properly set up event tracking and integrate the tool with your product;
- advanced user segmentation based on a variety of criteria, such as behavior, demographic attributes, and transaction data;
- in-depth analysis on user data, including cohort analysis, funnel analysis, and A/B testing that require statistical skills and an understanding of the principles of user behavior analysis.
Overall, Mixpanel is a powerful and versatile product analytics tool suitable for companies that need advanced tools to deeply understand user behavior, optimize their product and increase conversions.
Plausible

Plausible is a self-hosted web analytics platform that offers advanced features for users who want complete control over their data and privacy, without sacrificing powerful analytics tools. Unlike traditional analytics tools such as Google Analytics, Plausible is a self-hosted solution that is installed on its own server, eliminating the need to send data to third parties.
Plausible uses event tracking to record users’ interactions with the website. These events can include page views, clicks, downloads, subscriptions, and any other meaningful action a user takes on the site.
The Analytics tool enables detailed analysis of these events, segmenting users by various criteria and creating customized reports and visualizations to gain valuable insights into user behavior.
Plausible offers several advanced features that make it a powerful tool, but also more complex to use than other analysis tools. In fact, segmentation goes very deep, and it is necessary to know the terminology and parameters given to understand the numbers.
However, if your company has the technical skills, resources and analytical knowledge to use Plausible to its full potential, it can be a valuable investment in improving your users’ understanding and the success of your website.
BigQuery
BigQuery is a fully managed, scalable data warehouse offered by Google Cloud Platform that enables companies to store, analyze and query petabytes of data quickly and cost-effectively. Unlike traditional hardware-based data warehouses, BigQuery is a cloud solution that eliminates the need to manage IT infrastructure and offers automatic scalability to meet growing data analysis needs.
BigQuery uses a distributed analysis engine that allows queries on large datasets to be run in a parallel fashion on thousands of compute nodes. This allows query results to be obtained in seconds or minutes, even for petabyte datasets.
In addition, BigQuery supports the standard relational data model with tables, rows, and columns, and this facilitates integration with other enterprise tools and systems, such as databases, data lakes, and business intelligence tools.
